The City of Chicago and Chicago Public Schools (CPS) have made data on annual enrollments, school locations, and other school features available to the public. After a bit of wrangling (frankly maybe more than just a bit) these data can be used in R to get key visualizations.
My own interest in the schools data began with a desire to understand more about the spread of charter schools in the city, and also more about the sharp enrollment declines that some regular public high schools have experienced since the early ’00s. Putting together the annual enrollment data provided by the CPS into a longitudinal form gave some insights into both questions. In addition, the City provides a shapefile of school locations as of the 2014-2015 school year that has enough information to make a first pass at seeing the expansion of schools of other-than-regular governance. In this post I’ll share those illustrations.
library(tidyverse)
library(lubridate)
The all-high school enrollment data.frame is available at my github site in csv and Rds formats. In the command below we use RCurl::getURL to get the csv version directly from the raw files at github.
# The enrollment data#
require("RCurl")
library(RCurl)

enrollment_all_hs <-read.csv(text=getURL("https://raw.githubusercontent.com/cymack/CPSenrollment/master/enrollment_all_hs.csv"))
For most years, school governance, as I’ve called it, has only two levels, “regular” and “charter.” In 2016 a third level appears for the first time, “contract.” As there were only 4 contract high schools in that year, I’ve collapsed that factor with charter to create “charter etc.” Then I extracted a table of annual counts of regular and charter etc schools, and plotted a graph.
tbl.allschools_years_gov <-
  enrollment_all_hs %>%
  dplyr::mutate(govern = forcats::as_factor(govern)) %>%
  dplyr::mutate(govern = forcats::fct_collapse(govern, "charter etc" = c("charter", "other"))) %>%
  dplyr::group_by(year, govern) %>%
  dplyr::count()

# tbl.allschools_years_gov %>% print(n=24)

# So in any table or graph derived from this frame, the "charter etc" factor includes
# contract or other schools that in the main data frame are factored separately
# as "other."
So the visual evidence from this graph is that the number of charter and other schools of non-standard governance types has increased over the period, and that this increase has been the main dynamic in the number of high schools under CPS jurisdiction, since the number of regular schools has oscillated in a more steady manner. Though there is some up-and-downness, the share of non-standard schools has increased significantly.
We can get another perspective on the growth of the number of charter institutions by mapping school locations at different time points. The City of Chicago has, among numerous data files at its data hub site, a shapefile of school locations in the year 2014-2015. After some manipulations I’ve come up with spatial data.frames in sf (simple features) format for schools appearing in the enrollment_all_hs frame and the location frame, for the each of the years 2006-2007 and 2016-2017, available on my github site at the links. Again RCurl::getURL in the code chunk is aimed at the raw github files. It is hoped that in the first pass visualization the noise occasioned by mixing data across three years be overwhelmed by strength of the main effect.
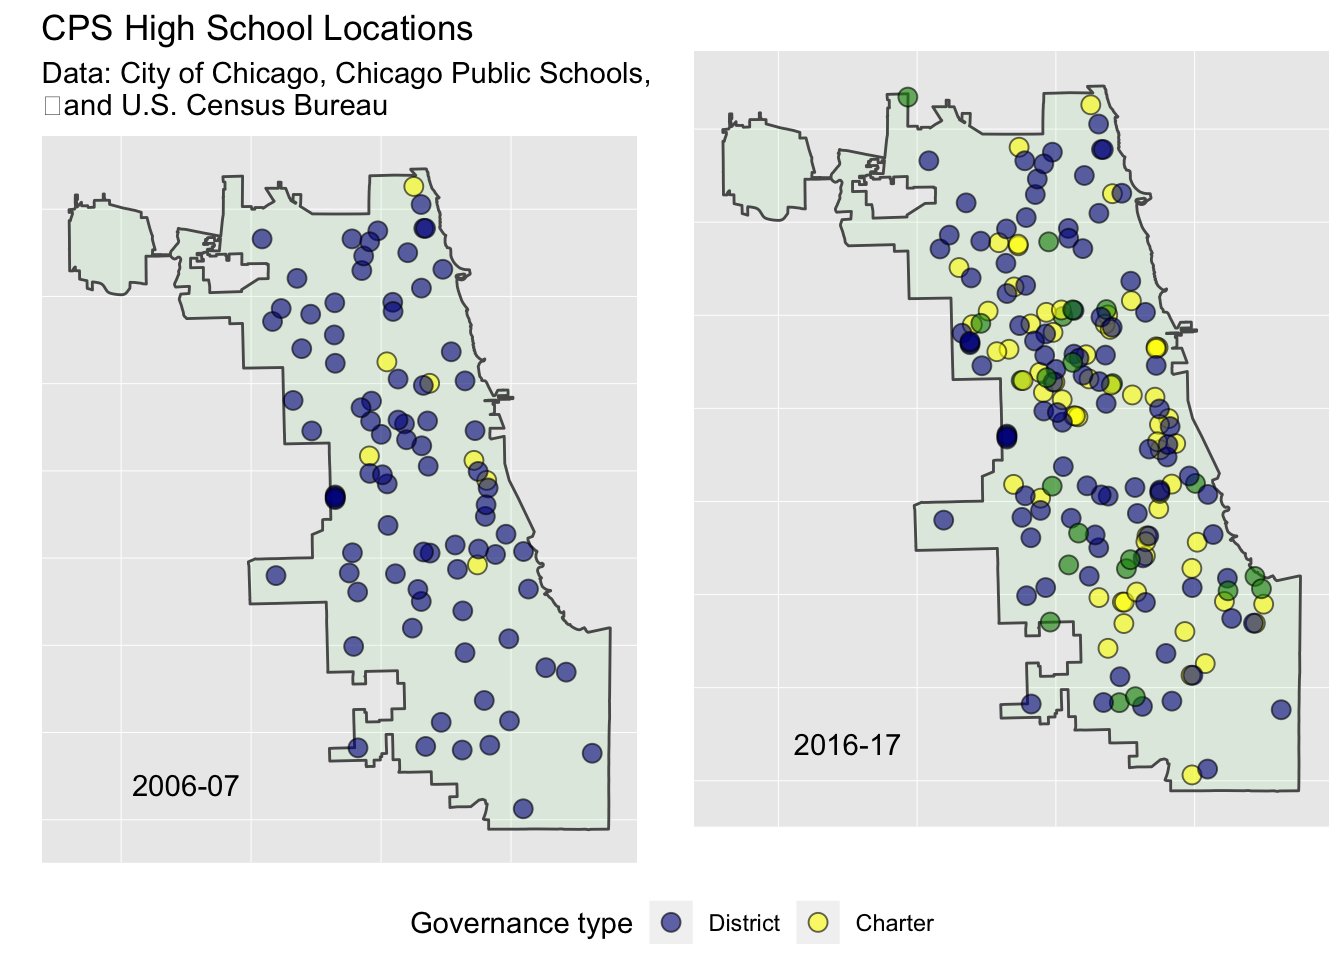
Another caveat is that the school types in the maps are derived from the locations data provided by the City of Chicago, and appears to be a different categorization from that in the CPS enrollment data set. The difference seems to affect mostly the charter and other options school types. In this case combining the charter and all other types into one factor level might actually have helped.
Clearly visible in the maps is the increase in number of high schools overall from 2006 to 2016. The increased density of locations is especially noticeable in the central area of the city, roughly to the west of downtown.